Satellite anomaly service
Notice
Due to resource optimization, we plan to discontinue this product. For your inputs, please contact space_weather-meteo_spatiale@nrcan-rncan.gc.ca
Disclaimer
The electron flux plot compares hourly range magnetic values (produced by this institute) with solar particle data recorded by NOAA's GOES Satellites. The hourly range values can be found under the Indices Archive and the GOES data can be downloaded from the NOAA's FTP.
The plot shows a comparison between magnetic conditions on the ground and particle conditions at geosynchronous orbit. Hourly ranges in the X component of the geomagnetic field (HRX) computed from NRCan's magnetic observatories are displayed on top panel. Particle fluxes observed by both primary and secondary GOES satellites (courtesy of NOAA/Space Weather Prediction Center in Boulder) are shown on bottom panel. The numbers after F indicate the particluar GOES satellite, with "e" for electron flux and "p" for proton flux. The numbers after ">" show energies in MeV. For information about this web service, please visit the Information page.
Observatory Information
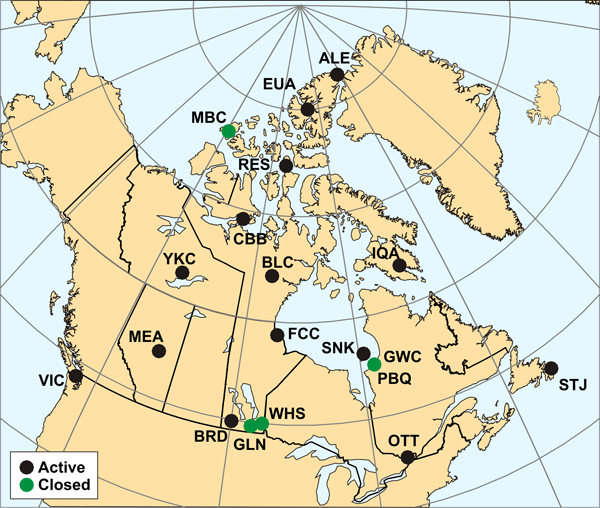
Click an observatory on the map or the table below to select it. This is an alternative way to choose a station for the Observatory field above. This will bring focus back to the observatory selection on the form.

| Name | Code | Latitude (°) | Longitude (°) | Opened (UT) | Closed (UT) |
|---|---|---|---|---|---|
| Baker Lake | BLC | 64.318 | 263.988 | 1974-01-01 | |
| Brandon | BRD | 49.870 | 260.026 | 2007-06-08 | |
| Cambridge Bay | CBB | 69.123 | 254.969 | 1972-07-20 | |
| Eureka | EUA | 80.000 | 274.100 | 2005-05-03 | |
| Fort Churchill | FCC | 58.759 | 265.912 | 1973-01-01 | |
| Glenlea | GLN | 49.645 | 262.880 | 1980-09-30 | 2006-05-01 |
| Great Whale River | GWC | 55.3 | 282.25 | 1973-01-01 | 1984-08-18 |
| Iqaluit | IQA | 63.753 | 291.482 | 1996-01-01 | |
| Mould Bay | MBC | 76.315 | 240.638 | 1980-01-01 | 1997-07-01 |
| Meanook | MEA | 54.616 | 246.653 | 1972-08-01 | |
| Ottawa | OTT | 45.403 | 284.448 | 1973-01-01 | |
| Poste de-la-Baleine | PBQ | 55.277 | 282.255 | 1984-09-09 | 2007-11-01 |
| Resolute Bay | RES | 74.690 | 265.105 | 1974-01-01 | |
| Sanikiluaq | SNK | 56.500 | 280.800 | 2006-11-06 | |
| St Johns | STJ | 47.595 | 307.323 | 1972-07-31 | |
| Victoria | VIC | 48.520 | 236.580 | 1973-01-01 | |
| Whiteshell | WHS | 49.8 | 264.75 | 1977-01-01 | 1979-12-31 |
| Yellowknife | YKC | 62.480 | 245.518 | 1975-01-01 |