
Quicklook summary
Geomagnetic Activity
| Current Conditions | 24 Hour Forecast | |
|---|---|---|
| Polar | active | unsettled + active intervals |
| Auroral | quiet | quiet + unsettled intervals |
| Sub-auroral | quiet | quiet |
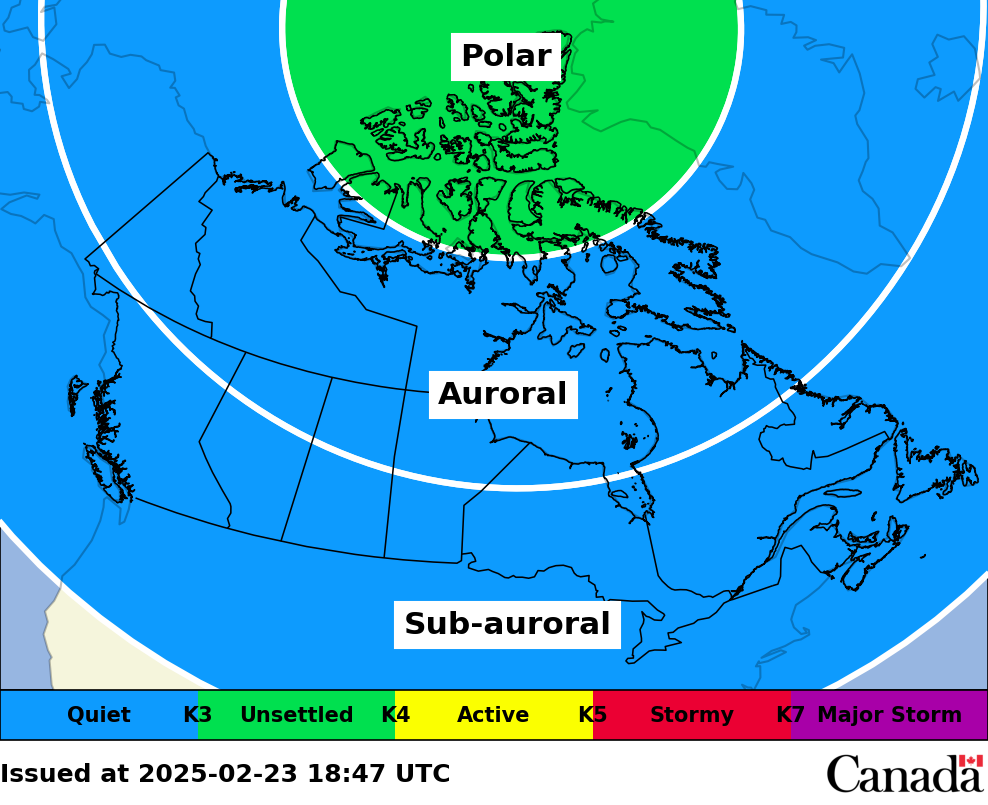
Current Conditions
at 2025-03-31 14:32 UT
- Polar: active
- Auroral: quiet
- Sub-auroral: quiet
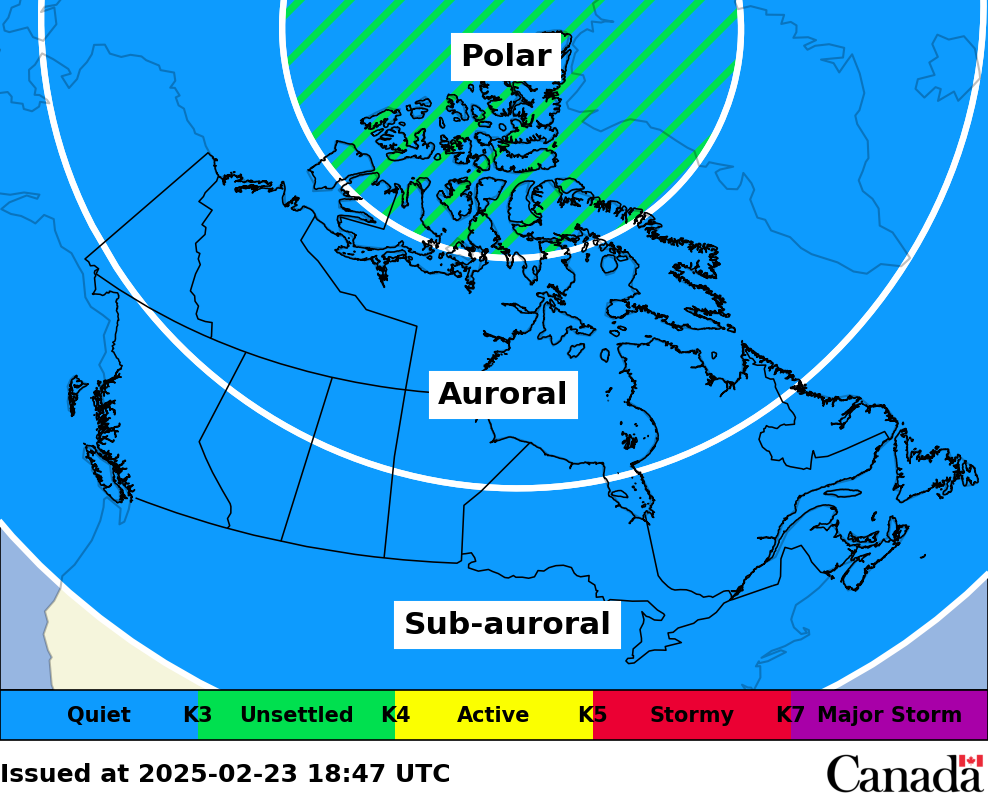
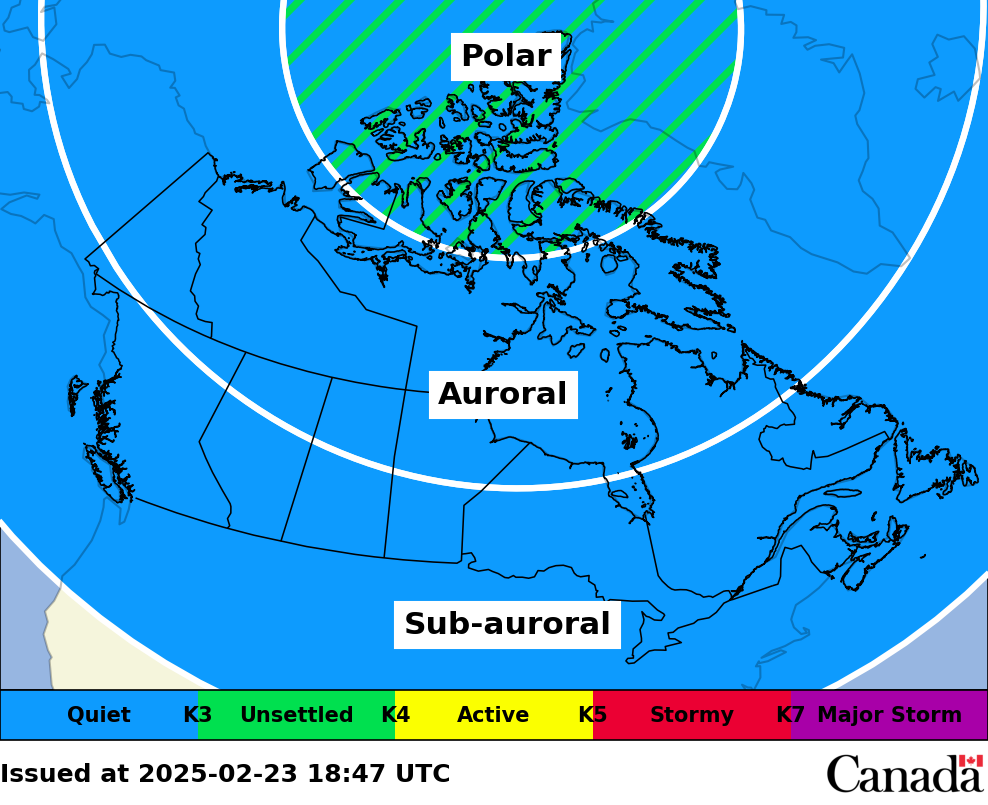
24 Hour Forecast
- Polar: unsettled + active intervals
- Auroral: quiet + unsettled intervals
- Sub-auroral: quiet
Review and Forecast
The following is a player that cycles through a series of images. For a text-alternative version please visit the Forecast - Tabular (zones)


Download the booklets on: